3Dプロット
作成者:上道 賢太
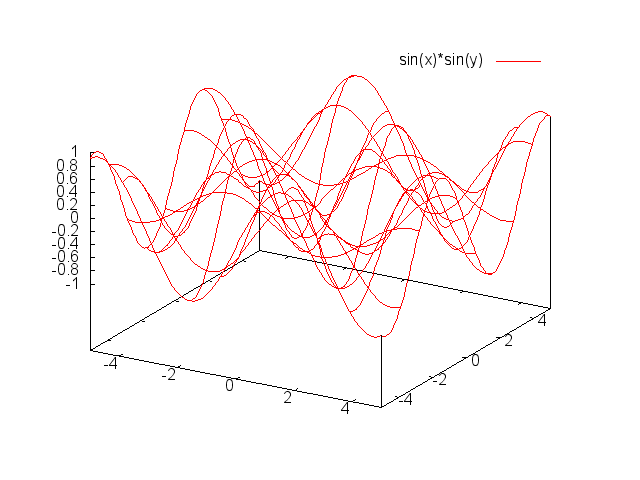
・3次元グラフを描画する
3次元グラフを描画する方法です.コマンドはsplotを使います.まずは,基本的なグラフを描いてみます.
|
$gnuplot > set xrange[-5:5] $gnuplot > set yrange[-5:5] $gnuplot > splot sin(x)*sin(y) |
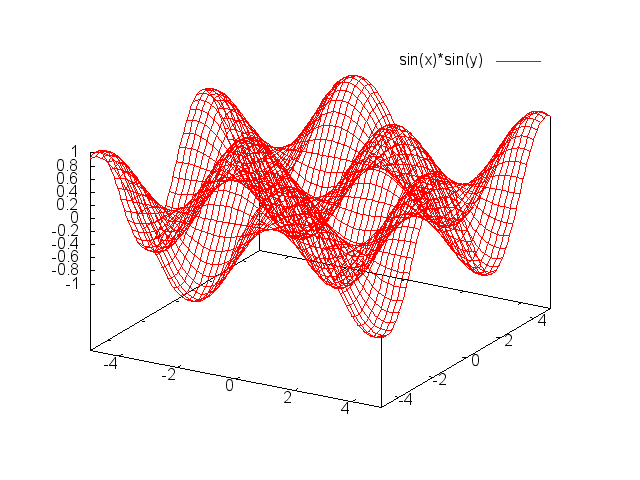
少し見づらいので孤立線を増やします.
|
$gnuplot > set xrange[-5:5] $gnuplot > set yrange[-5:5] $gnuplot > set isosamples 50 $gnuplot > splot sin(x)*sin(y) |
・カラーマップ
次は,カラーマップで描画します.先ほどのコマンドにwith pm3dをつけるだけで カラーマップが作れます.
|
$gnuplot > set xrange[-5:5] $gnuplot > set yrange[-5:5] $gnuplot > set isosamples 50 $gnuplot > splot sin(x)*sin(y) with pm3d |
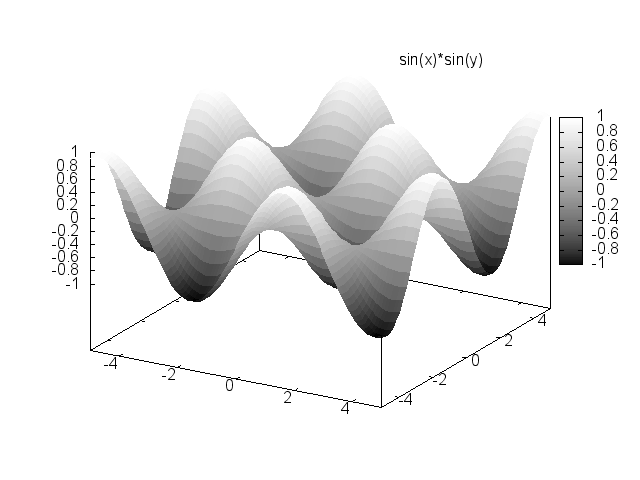
色を変えてみます.まずは,グレースケール.set palette grayを使う.
|
$gnuplot > set xrange[-5:5] $gnuplot > set yrange[-5:5] $gnuplot > set isosamples 50 $gnuplot > set palette gray $gnuplot > splot sin(x)*sin(y) with pm3d |
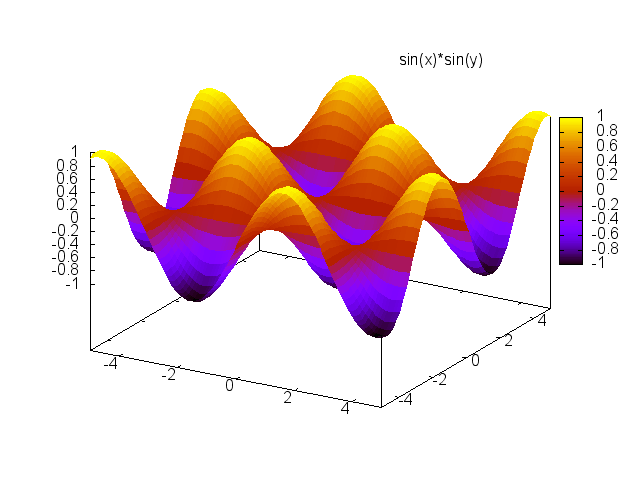
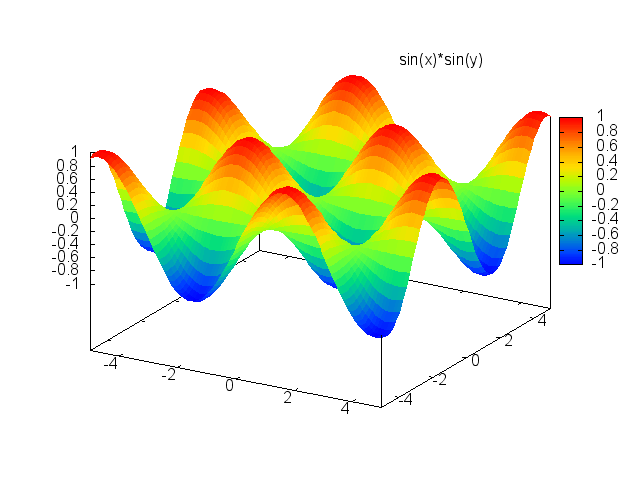
次は,虹色.set palette rgbformula 22,13,-31で虹色になります.数値を変えることで他の色にも できます.
|
$gnuplot > set xrange[-5:5] $gnuplot > set yrange[-5:5] $gnuplot > set isosamples 50 $gnuplot > set palette rgbformula 22,13,-31 $gnuplot > splot sin(x)*sin(y) with pm3d |
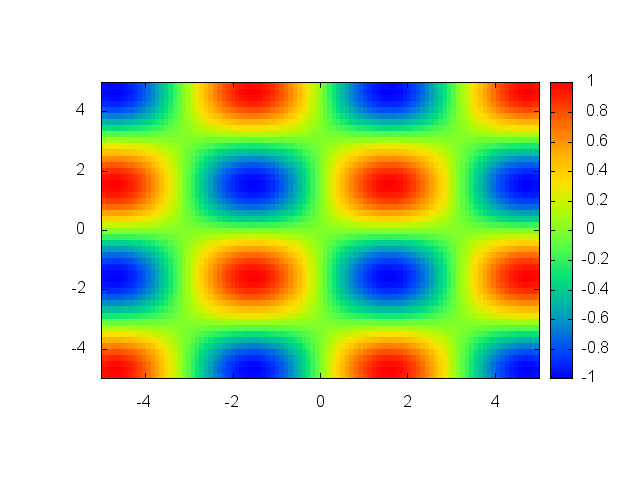
・マップビューで表示
set view mapを使用.
|
$gnuplot > set xrange[-5:5] $gnuplot > set yrange[-5:5] $gnuplot > set isosamples 50 $gnuplot > set palette rgbformula 22,13,-31 $gnuplot > set view map $gnuplot > splot sin(x)*sin(y) with pm3d |
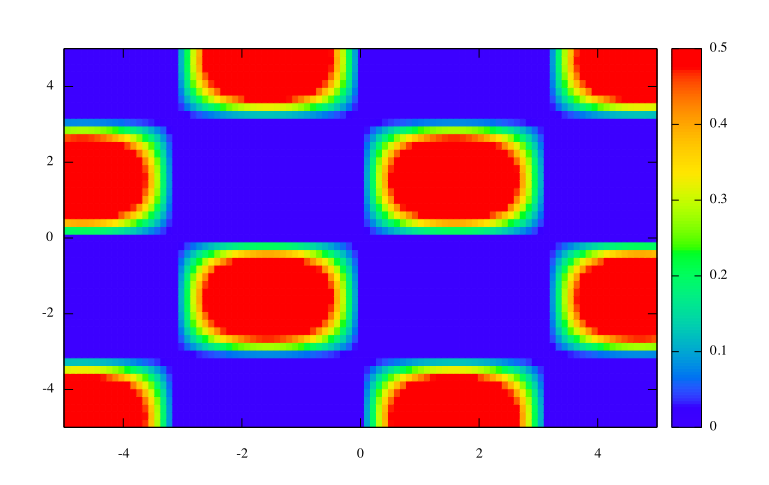
・カラーバーの範囲を指定する
set cbrange[0:0.5]を使用.
|
$gnuplot > set xrange[-5:5] $gnuplot > set yrange[-5:5] $gnuplot > set isosamples 50 $gnuplot > set palette rgbformula 22,13,-31 $gnuplot > set view map $gnuplot > set cvrange[0:0.5] $gnuplot > splot sin(x)*sin(y) with pm3d |